Market Internals Suggest Equities Are on Thin Ice
Could relief finally be arriving for strained energy buyers? A historic, unprecedented release from global petroleum reserves has just been proposed by the International Energy Agency. While crude prices initially retreated from Monday's spikes over $100, they are climbing once more. Meanwhile, pre-market indicators suggest Wall Street will open in the red. Tuesday evening brought some optimism via Oracle’s strong earnings release, as investors now brace for today's crucial U.S. CPI figures.
3/11/20263 min read
Under the Surface: Warning Signs Flashing
Did the charts predict the drop, or was it pure coincidence?
Earlier this year, the notorious Hindenburg Omen—a charting pattern historically linked to severe market downturns—triggered on multiple occasions throughout January and February. When these signals cluster together, analysts generally interpret them as a highly credible threat.
Right on cue, the S&P 500 suffered a rapid 5% correction, while the VIX volatility index surged on Monday to levels unseen since the "Liberation Day" panic of last year. Of course, a mathematical market indicator named after a tragic zeppelin couldn’t have literally predicted military strikes on Iran.
We cannot know if the market would have corrected without the geopolitical catalyst. A similar situation occurred in 2019 when the Hindenburg Omen and the ominous "Titanic Indicator" flashed simultaneously just before the COVID-19 crash. They didn't predict a virus, but they did highlight underlying fragility. And yes, sometimes these indicators offer false positives.
However, brushing off technical analysis entirely would be a mistake. While it cannot predict external geopolitical shocks, observing market internals offers vital clues that fundamental analysis might miss. If broad indexes show the market's "surface," technical metrics act as an X-ray revealing hidden weaknesses.
Today's internal diagnostic looks troubling. For instance, the High-Low Logic Index from Ned Davis Research—a key metric of market turbulence—recently spiked to its third-highest level in history. Similarly, SentimenTrader’s proprietary S-TCTM Risk-Warning Model just triggered a definitive bearish alert.
Beneath the calm exterior of the major benchmarks, heavy rotation is occurring. The "Magnificent Seven" tech giants, which largely carried the market higher since 2022, are actually underperforming the broader index in 2026. Furthermore, secondary software firms are taking a hit over concerns that artificial intelligence will render their business models obsolete.
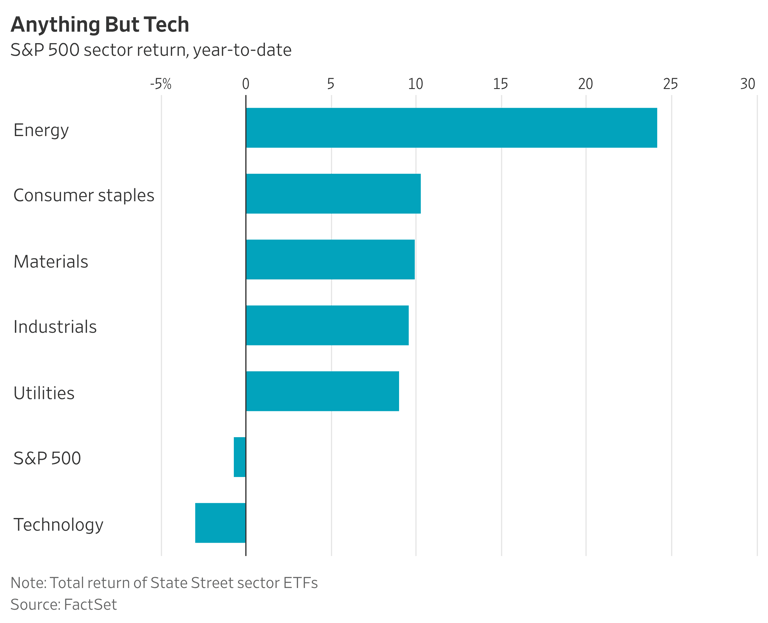
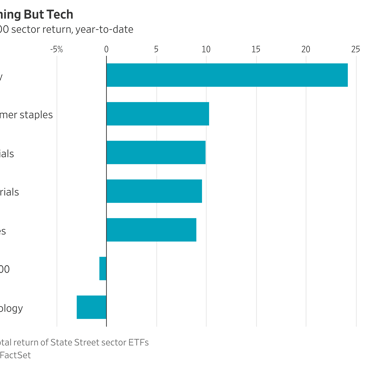
The primary reason the broader market hasn't collapsed is a massive rotation into traditionally defensive or cyclical sectors. Utilities, industrials, materials, energy, and consumer staples have all jumped by 9% or more year-to-date.
Except for the energy sector benefiting from Middle East tensions, these traditional industries haven't experienced a sudden earnings boom. Since the tech sector's market capitalization dwarfs these traditional groups combined, this balancing act may fail if the divergence persists.
Technical indicators might not always be perfectly accurate, but consulting them is a smart way to get a second opinion on your portfolio's health.
Key Equities in Focus
Oracle: The software giant surged 10% in pre-market trading after boosting its revenue forecasts, driven by an insatiable appetite for artificial intelligence infrastructure.
Rheinmetall: The German defense contractor dropped 5% following an unexpected earnings miss.
Campbell’s: Investors are watching the soup manufacturer's morning earnings release closely to see if management can reverse a persistent decline in sales.
Sprinklr & UiPath: Both tech firms report today; markets will intensely scrutinize their progress in deploying AI tools.
Inditex: The corporate parent of Zara saw its stock climb following robust financial results.
Market Radar: Essential Reading
Shifting Oil Routes: Iran has surprisingly ramped up oil exports through the Strait of Hormuz, with China acting as its primary buyer.
Pipeline Pressures: The current bottleneck in the Strait of Hormuz has elevated the Saudi East-West pipeline into one of the most vital geopolitical assets on the globe.
Social Media Misstep: U.S. Energy Secretary Chris Wright caused brief market chaos on Tuesday after tweeting that American forces were escorting oil tankers. The tweet temporarily drove oil down and stocks up before being deleted. The U.S. military is not currently providing escorts.
Meta's Next Move: The parent company of Facebook and Instagram is reportedly acquiring a new social network designed entirely for AI chatbots.
Labor Market Stagnation: Mounting data suggests the U.S. economy actually generated zero net new jobs over the entirety of 2025.
Today in Financial History
On this exact date in 2020, the World Health Organization officially declared COVID-19 a global pandemic. However, financial markets had already anticipated the disaster. By the time of the announcement, equities were in freefall, with the S&P 500 erasing over 30% of its value in a matter of weeks.
Lenexecute
I’m James Wilson. I spent over a decade as a senior analyst at a Greenwich-based hedge fund, managing the noise of the mid-cap and tech sectors. I’ve seen how the "big money" moves, and frankly, most retail news is 24 hours too late.
Every workday morning, I send out my Stock Market AM notes
Contact
James Wilson
Chief Market Strategist | Lenexecute
2 Greenwich Plaza, Suite 200
Greenwich, CT 06830
Direct: (203) 622-0195
lenexecute.com
© 2026. All rights reserved.